
In this post I briefly compare the results of dollar-cost averaging into VAS and the LICs discussed in my recent interview with Peter Thornhill.
This was first posted in a private Facebook group after my podcast interview with Peter Thornhill- Episode #11.
Disclaimer-this is not financial advice, consult a paid advisor prior to making any investment decision
Background
Passive investing has become a very popular in Australia since the Global Financial Crisis in 2008. The underlying premise is that the average investor is better off in the long term by investing in a broad based and diversified portfolio, rather than picking individual stocks.
Exchange traded funds, like VAS, and Listed Investment Companies allow investors to diversify their portfolio in a large number of businesses through a single transaction. This reduces mnagement cost and frees up time to do moe important things.
But which is better- ETFs or LICs? There is no correct answer and I am not going into the subtle differences here. You can read more in my other posts Managed Money Part 1 and Managed Money Part 2.
What I have done is compared what a dollar cost averaging strategy for VAS and some popular LICs would have produced over the past 10 years.
Method
Analysis completed on 18/4/2020 using Sharesight.
$1,000 invested every year on the 1st of January
Started 1/1/2010 up to and including 1/1/2020
Number of shares purchased = 1000/ price rounded to nearest whole share or unit
Price= price on 1st January as defined by Sharesight which has data going back up to 20 years.
Franking credits have been applied to dividend calculation
Dividend reinvestment included
2010 was selected as VAS listed in 2009.

Total Amount Invested Over 11 Purchases (to account for rounding)
AFI $10,974.99
ARG $10,958.93
MLT $10,970.92
WHF $10,979.15
VAS$10,547.49
MFF $10,987.13
PMC $10,991.90
Results
Image shows the dollar return with the breakdown into portfolio value, capital gains, dividends (including franking credits) and the total return.
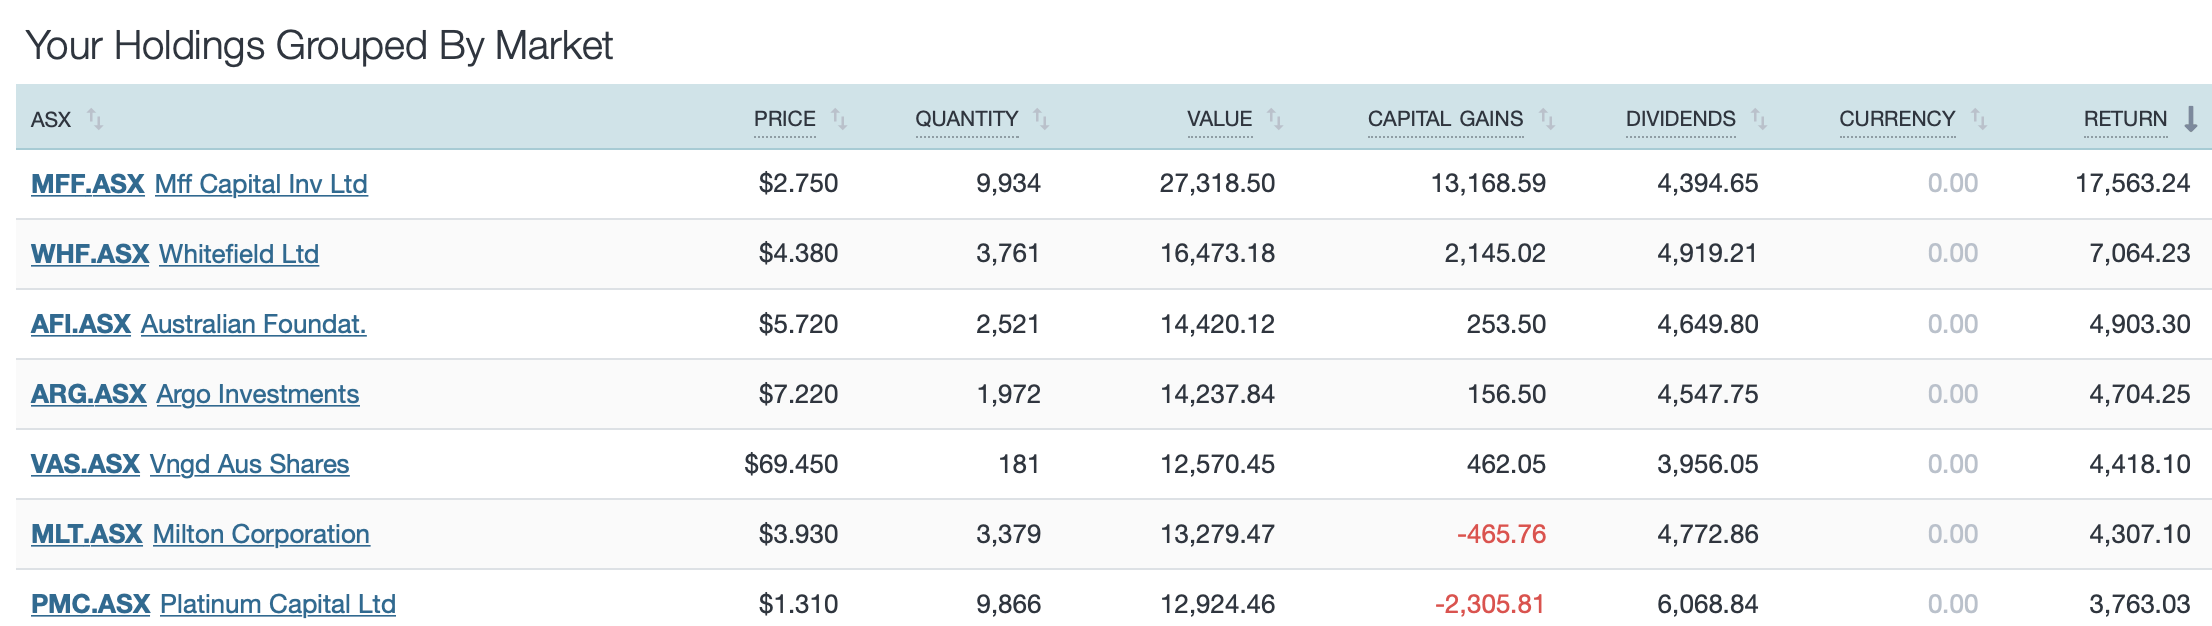
Image shows the percentage return with the breakdown into portfolio value, capital gains, dividends (including franking credits) and the annual % return.
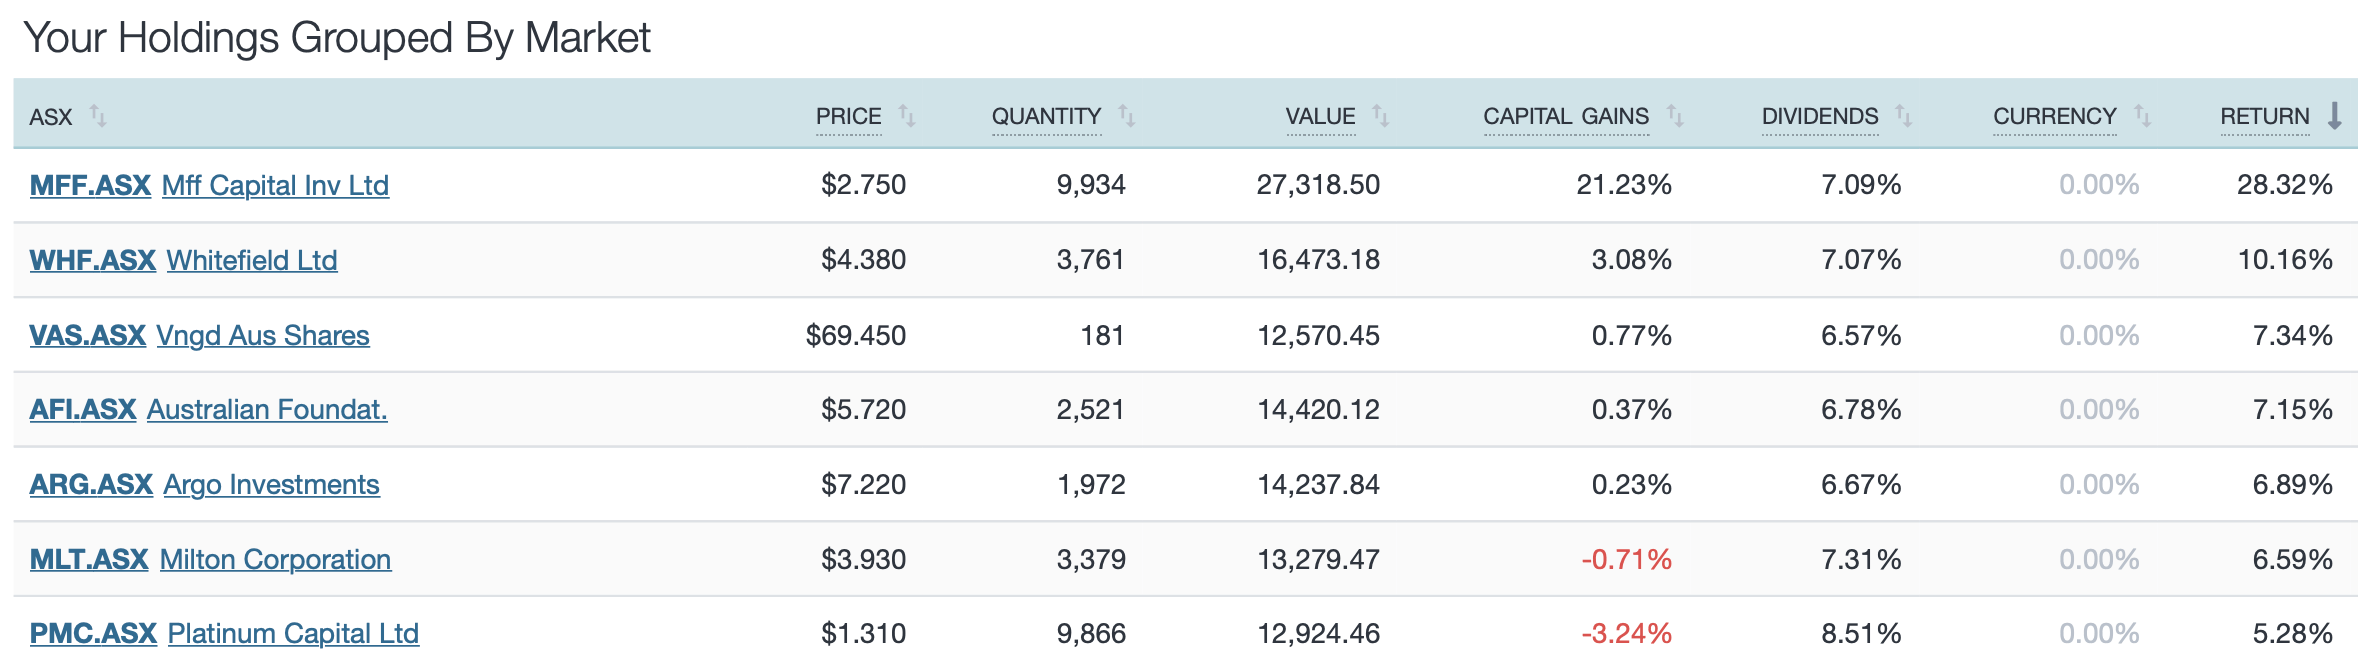
The recent correction has obviously hit capital gains hard but this is a good representation of the income that can be achieved by investing passively, but consistently, over the long term with a very simple strategy.
I want to thanks Peter Thornhill for sharing his time and insights.
This analysis was created using Sharesight- the most comprehensive way to track your portfolio. Use this link to track 10 holdings for free and get 2 months free if you upgrade to a paid plan.


2 Replies to “VAS vs LICs- A 10 Year Backtest”